Setting the record straight on nonprofit funding
Why stale financials make donors suspicious, plus a featured chart on how revenue mix differs between large and small nonprofits.
Writing
Benchmark data for staff and executive pay, plus trends like top-earning program areas and whose salaries are rising or falling.
Read the post ↗ Report launch · Candid blogA first look at the most complete source of nonprofit compensation data, built on executive salaries from Form 990 filings.
Read the post ↗ How-to · Candid blogA practical guide to planning and launching a campaign that gets the word out about mission-driven work.
Read the post ↗Campaign collateral
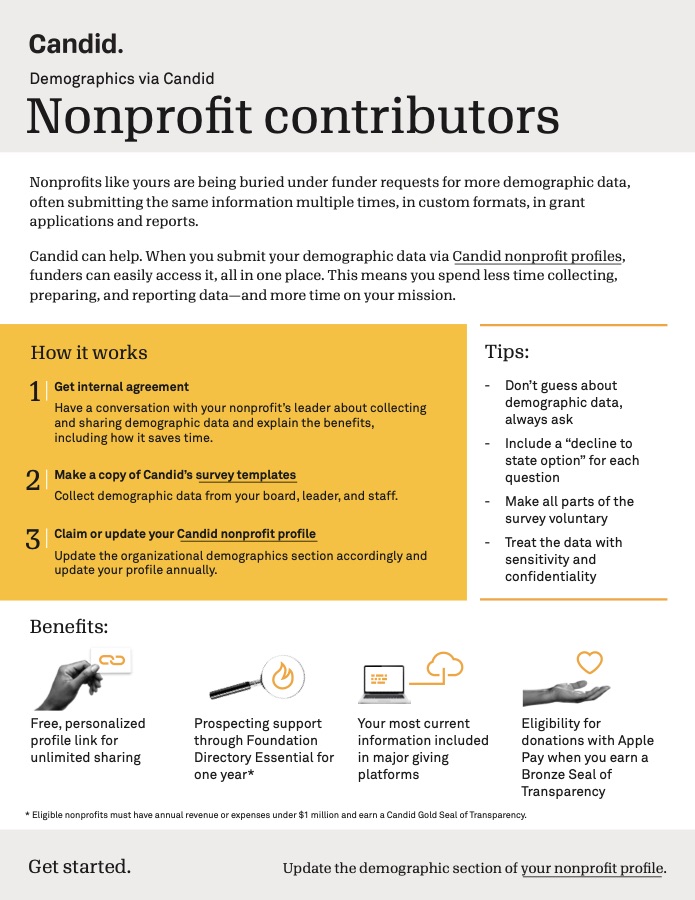
Shows nonprofits how to share demographic data once, through their Candid profile, instead of filling out the same request for every funder.
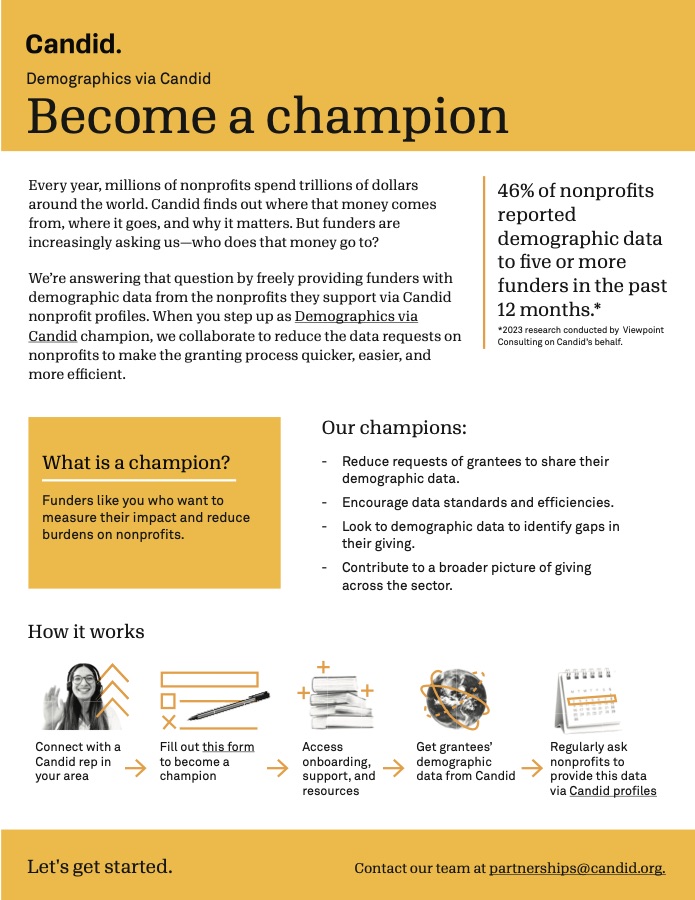
The version of the same campaign for funders. The campaign recruited nearly 200 partners.
I owned strategy, content, segmentation, testing, and deployment for Candid's biweekly newsletter to over 500,000 subscribers, reaching a 40% open rate and doubling click-through from 1% to 2%.
Why stale financials make donors suspicious, plus a featured chart on how revenue mix differs between large and small nonprofits.
Why keeping current funders pays off more than chasing new ones, with a chart showing Gen Z gave at a higher rate than any other generation.
Social media
Data carousels
Mission over myth: earned income
A myth-vs-fact series on earned income, which makes up over 70% of nonprofit revenue. It ends with what nonprofits should and shouldn't do about the myth.
PDF ↗ LinkedIn ↗ Instagram ↗
Donors want nonprofits to get out the vote
Results from a 2026 M+R donor survey, one finding per slide, followed by ways nonprofits can support voter education.
PDF ↗ LinkedIn ↗ Instagram ↗